Profiling the JVM with async-profiler
Most of the older Java profilers (VisualVM, JProfiler’s legacy sampling modes, the old hprof agent) only capture stacks when threads hit a safepoint. The trouble is that threads aren’t evenly spread across the code at the moment they reach one. Some methods are full of safepoints, others have none at all. The profile you get is skewed, and you can end up optimising code that isn’t the real culprit. That’s safepoint bias.
async-profiler doesn’t have that problem. It uses the kernel’s perf_events (or an internal timer) to interrupt threads anywhere, then grabs the stack through AsyncGetCallTrace. Overhead stays in the low single-digit percent, which makes it fine to run in production.
This article takes it for a spin on a concrete case: a small application with three problems planted on purpose, profiled in CPU, wall-clock, allocation and lock mode, then fixed and profiled again. Everything below was run with async-profiler 4.5 and JDK 25, in a Linux container.
Installing the tool
async-profiler is downloaded from the project’s releases page, as one archive per platform (Linux x64, Linux arm64, macOS). Nothing to install:
curl -sLO https://github.com/async-profiler/async-profiler/releases/download/v4.5/async-profiler-4.5-linux-x64.tar.gz
tar xzf async-profiler-4.5-linux-x64.tar.gz
async-profiler-4.5-linux-x64/bin/asprof --version
The archive holds two binaries in bin/, asprof and jfrconv, and the lib/libasyncProfiler.so library. That library is what gets loaded into the target JVM. asprof only attaches to it and sends it commands.
Start with one command
To profile the CPU of a running process for 30 seconds and get a flamegraph out of it:
asprof -d 30 -f profile.html <pid>The default event is cpu. The output format is inferred from the file extension: .html gives you an interactive flamegraph. Instead of a pid, you can give the main class name as jps shows it, or the word jps if there is only one JVM on the machine. For a first diagnosis, that’s enough.
The example application
For the profiles that follow to mean anything, we need an application with real defects. Here is a short one. Four worker threads process orders in a loop. For each order: validate a hundred email addresses, build a text report, then save it to a database simulated by a Thread.sleep(1).
public class Shop {

    static final Object DB = new Object();

    // Problem 1: the regex is compiled on every call.
    static boolean validate(Order order) {
        for (String email : order.emails()) {
            Pattern p = Pattern.compile("^[\\w.+-]+@[\\w-]+\\.[\\w.]+$");
            if (!p.matcher(email).matches()) return false;
        }
        return true;
    }

    // Problem 2: the report is built by concatenation in a loop.
    static String report(Order order) {
        String out = "";
        for (int i = 0; i < order.lines(); i++) {
            out += "line " + i + ";";
        }
        return out;
    }

    // Problem 3: the database call happens under a global lock.
    static void save(Order order, String report) {
        synchronized (DB) {
            fakeDbCall(report);
        }
    }
}
The main thread prints the throughput every five seconds. Before any fix:
708 orders/s
709 orders/s
716 orders/s
We start the JVM with the two flags discussed further down, then profile.
java -XX:+UnlockDiagnosticVMOptions -XX:+DebugNonSafepoints Shop 4Choosing what to measure
The real value of the tool is that you cover several dimensions with the same binary through -e:
asprof -d 15 -e cpu   -f cpu.html   Shop   # CPU time
asprof -d 15 -e wall  -f wall.html  Shop   # wall-clock (real time)
asprof -d 15 -e alloc -f alloc.html Shop   # heap allocations
asprof -d 15 -e lock  -f lock.html  Shop   # lock contention
Here is what each one gives on our application.
CPU: where the processor works
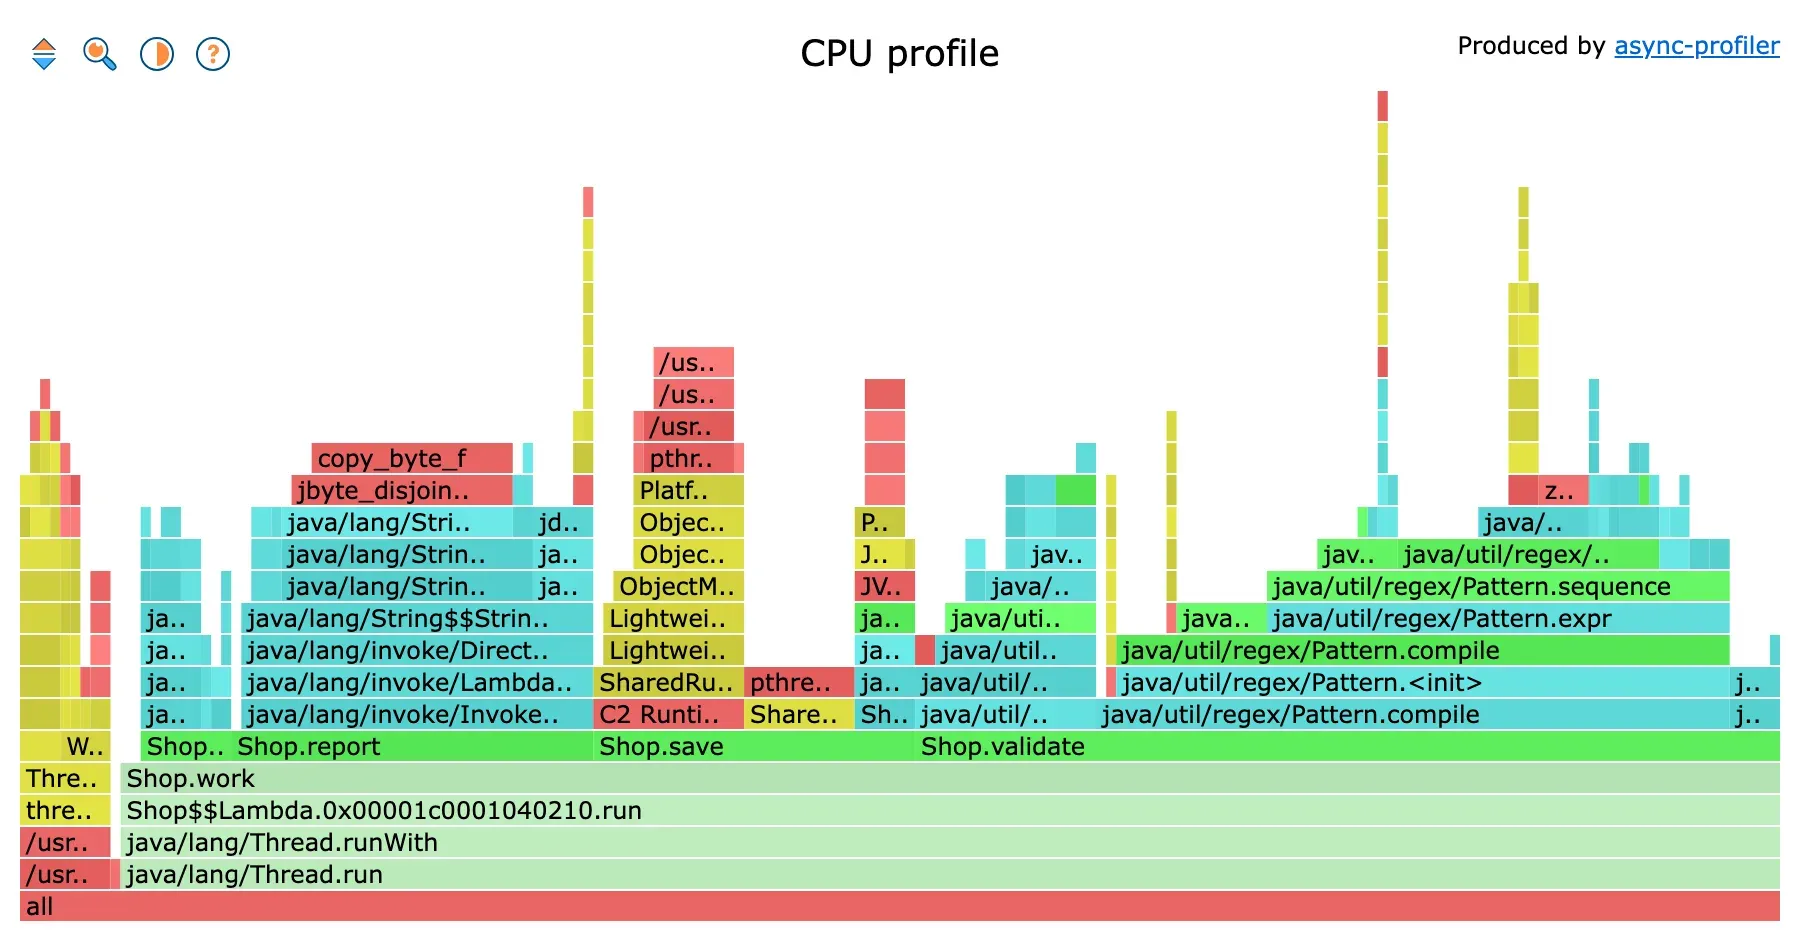
CPU profile, fifteen seconds. Three blocks above Shop.work: report, save and validate.
The graph reads from the bottom up, and the flamegraph article covers the reading in detail. The essentials: Shop.validate takes 49% of the CPU, and almost all of it is in Pattern.compile (36%), not in the check itself. Shop.report takes 21%, in string concatenation. Shop.save takes 18%, and that’s mostly the JVM’s lock machinery, in yellow.
The same profile as text, with -o flat, lists the methods that were at the top of the stack when the sample was taken:
--- Execution profile ---
Total samples       : 188

          ns  percent  samples  top
  ----------  -------  -------  ---
   160000000    8.51%       16  /usr/lib/aarch64-linux-gnu/libc.so.6
   150000000    7.98%       15  copy_byte_f
   120000000    6.38%       12  java.util.regex.Pattern.has
   110000000    5.85%       11  pthread_cond_signal
   110000000    5.85%       11  java.util.regex.Pattern.clazz
   100000000    5.32%       10  java.util.regex.Pattern.sequence
    80000000    4.26%        8  java.util.regex.Pattern.compile
This format answers “which method burns CPU directly”. It doesn’t say who calls it. For that, -o traces prints the full stacks, most frequent first:
--- 240000000 ns (12.83%), 24 samples
  [ 0] copy_byte_f
  [ 1] jbyte_disjoint_arraycopy
  [ 2] java.lang.String.getBytes
  [ 3] java.lang.StringConcatHelper.prepend
  [ 4] java.lang.String$$StringConcat.0x00001c0001040c00.prepend
  [ 5] java.lang.String$$StringConcat.0x00001c0001040c00.concat
  ...
  [ 9] Shop.report
  [10] Shop.work
A native memory copy, called by string concatenation, called by report. The diagnosis is already there.
One detail worth knowing: 188 samples in fifteen seconds is not many. By default, a CPU sample is taken every 10 ms of consumed processor time. The application was only using a small fraction of one core, because the workers spend their time waiting. Which brings us to the next mode.
Wall-clock: where the time goes
The cpu mode only counts the time threads actually spend running on a core. It doesn’t see a thread blocked on I/O, waiting for a lock, or in a sleep. If your latency comes from a network call or a slow SQL query, the CPU profile will be almost empty while the problem is very much there. In that case you need wall.
In wall-clock mode, each thread gets a sample at a fixed interval, whether it works or sleeps. You almost always use it with -t, which splits the stacks by thread, and with an -I filter to keep only the threads you care about. Without that, the JVM’s service threads, which sleep all the time, drown the graph.
asprof -d 15 -e wall -t -I '*worker*' -f wall.html Shop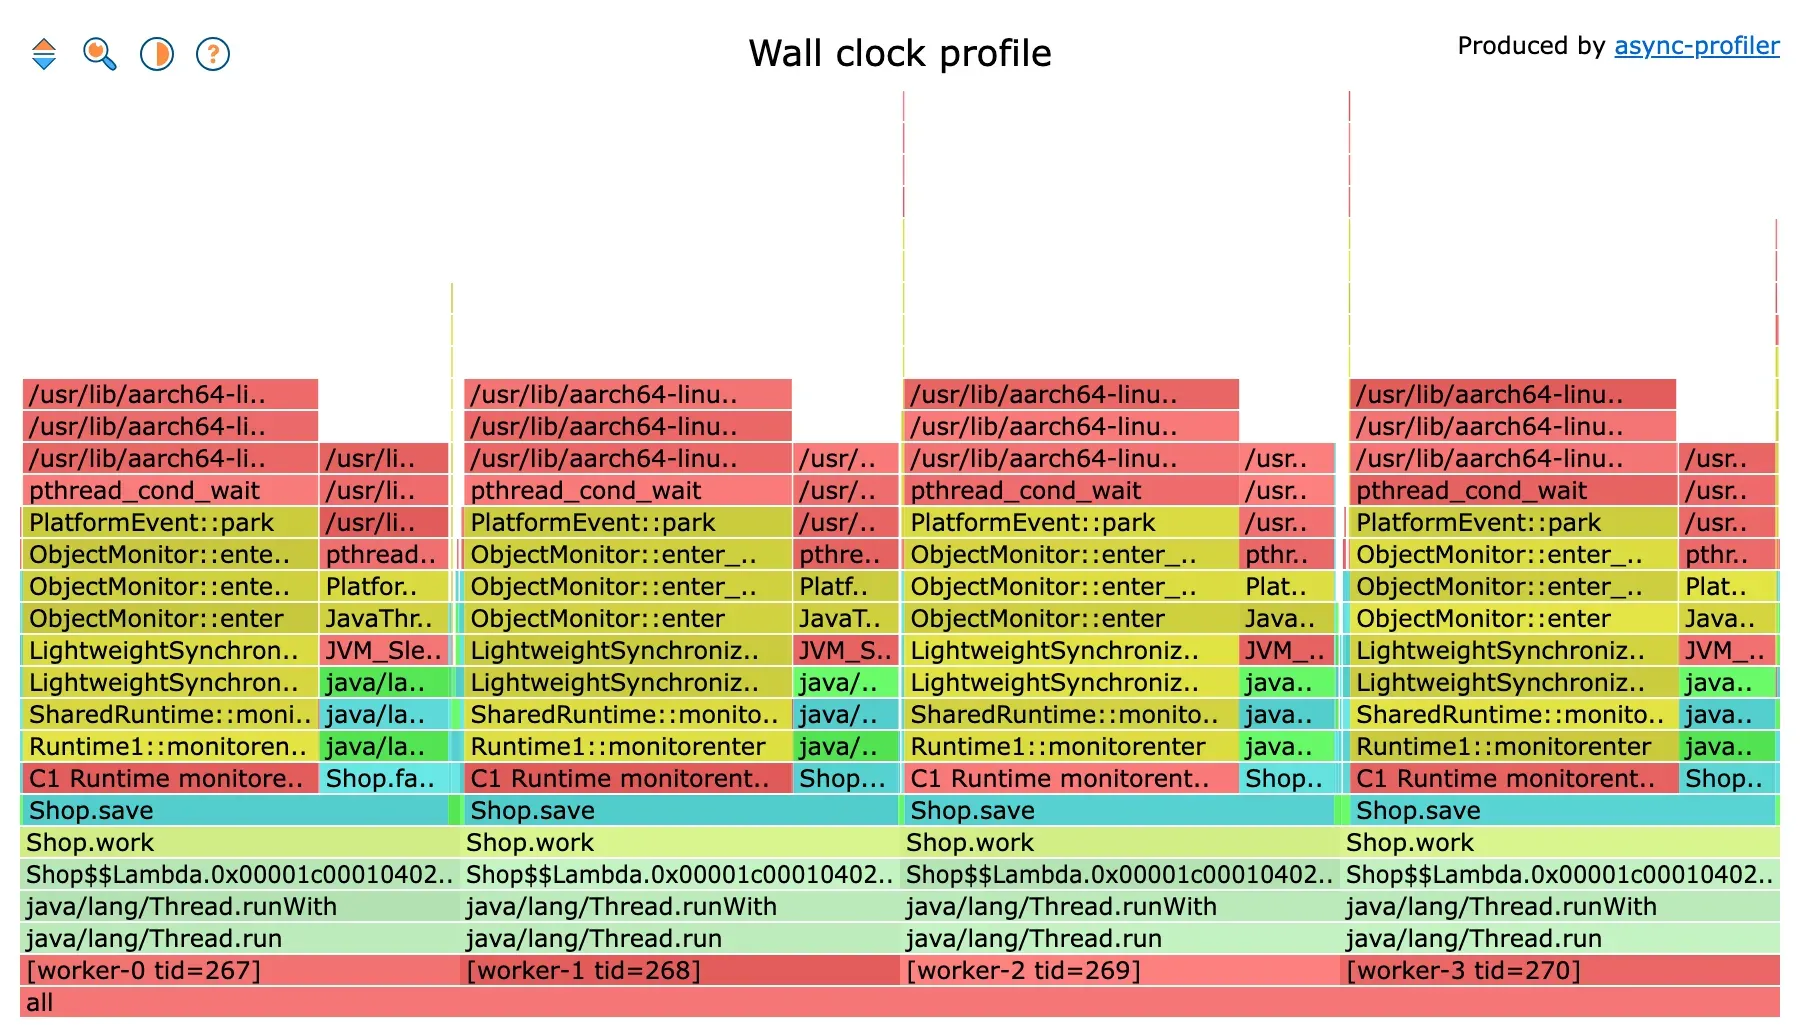
Wall-clock, four workers. Almost the full width is under Shop.save.
The result is clear. Each worker spends 97% of its time in Shop.save. Inside it, 73% waiting for the lock (ObjectMonitor::enter) and 24% in the sleep that simulates the database. The useful work, validate and report, is less than 3% of the width. The four workers queue up in front of a single lock, and the fake database serves only one thread at a time.
Allocations: what fills the heap
The alloc mode is precious for tracking down GC pressure. It shows where the heap is allocated, and so points directly at the loops that create too many temporary objects. The measurement doesn’t rely on instrumentation: the JVM notifies the profiler every time a thread receives a new allocation block (a TLAB) or allocates a large object outside one. Overhead stays low and the JIT isn’t disturbed.
![Allocation flamegraph: byte[] on top of Shop.report, boolean[] and int[] on top of Shop.validate](/_astro/alloc.DeWE5YS7_Z1UjfIg.webp)
Allocation profile. The top frame is the allocated class, the width is in bytes.
Here the top frame is no longer a method but the class of the allocated object, and the width measures bytes. byte[] accounts for 47% of allocations and comes from Shop.report: every += copies the whole string into a new array. boolean[] accounts for 23% and comes from Pattern.compile: every compilation of the regex builds its character tables. In fifteen seconds, the application allocated 3.9 GB.
Two useful options: --alloc 1m sets the sampling interval (one sample per allocated megabyte), and --live keeps only the objects still alive at the end of the session, which makes it a lightweight leak detector.
Locks: who waits for whom
The lock mode measures the time spent waiting to enter a synchronized block or a Lock. The top frame is the class of the lock, and the width is in nanoseconds of waiting.

Lock profile. One lock, one place.
Hard to be clearer. A single lock, of type java.lang.Object, taken in Shop.save. The text output gives the scale: 44 seconds of cumulated waiting over a fifteen-second window. Four threads, three of which are waiting at any time. The --lock 10ms option ignores short waits and keeps only the ones that matter.
Fix, then measure again
The three fixes are the ones you’d expect: compile the regex once in a static field, build the report with a StringBuilder, and remove the global lock so each worker talks to the database on its own.
static final Pattern EMAIL = Pattern.compile("^[\\w.+-]+@[\\w-]+\\.[\\w.]+$");

static String report(Order order) {
    StringBuilder out = new StringBuilder();
    for (int i = 0; i < order.lines(); i++) {
        out.append("line ").append(i).append(';');
    }
    return out.toString();
}

static void save(Order order, String report) {
    fakeDbCall(report);
}
Throughput goes from 710 to 2,930 orders per second, four times as much:
2934 orders/s
2959 orders/s
2908 orders/s
And we profile again, under the same conditions, to check that the profile tells the same story.
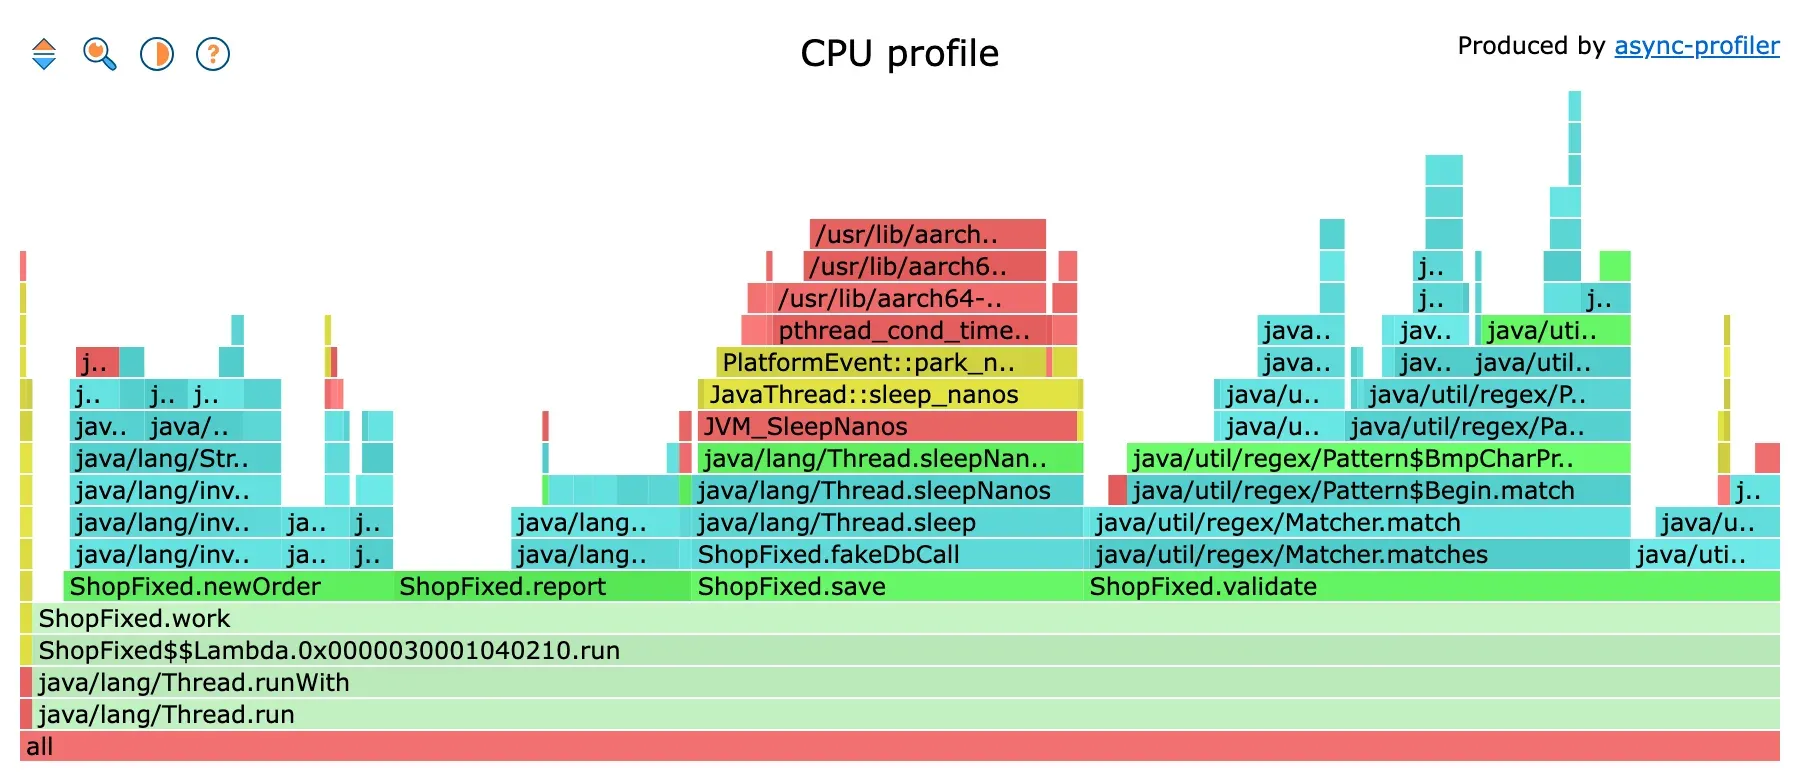
CPU profile after the fix. Pattern.compile is gone, the database sleep has become visible.
Pattern.compile is gone. validate now contains Matcher.match, the real work, for 31% of the CPU. report dropped to 17%, and save has become a Thread.sleep: the database’s time, which we won’t fix in this program. The lock profile is empty, zero samples. Allocations fall to 1.2 GB over fifteen seconds, for four times as many orders processed. Per order, that’s thirteen times less memory allocated.
That’s the real profiling loop: measure, fix, measure again. The second profile says what became the widest, and here it’s downstream.
Output formats
The format is chosen with -o, or by the extension of the file given to -f:
| Format | What you get |
|---|---|
flamegraph (.html) | The interactive flamegraph, a single file, no dependency |
flat | The methods at the top of the stack, sorted by samples |
traces | The full stacks, most frequent first |
collapsed | One stack per line, for the FlameGraph project’s scripts |
tree | An HTML call tree, expandable |
jfr (.jfr) | A JFR recording, readable in JDK Mission Control |
A few options change the shape of the result without changing the measurement. -t splits stacks by thread. -s uses short class names. --reverse flips the graph to start from the leaves. --minwidth 1 hides frames under 1%. -I and -X keep or exclude stacks containing a pattern, with wildcards: -I '*worker*', -X '*Compile*'. --title changes the HTML title.
Driving a session
asprof -d 30 starts, waits and stops. For a longer session, or one driven from a script, you split the steps:
asprof start -e cpu Shop           # starts, returns immediately
asprof status Shop                 # "Profiling is running for 5 seconds"
asprof dump -o flat -f now.txt Shop   # writes a result without stopping
asprof stop -f profile.html Shop   # stops and writes the final file
For continuous profiling, --loop 1h -f /var/log/profile-%t.jfr writes one file per hour, %t being replaced by the date and time. That’s what most continuous profiling tools, like Pyroscope, do under the hood.
Getting accurate stacks: DebugNonSafepoints
For Java frames to be attributed to the right place, and not snapped to the nearest safepoint, start the JVM with:
-XX:+UnlockDiagnosticVMOptions -XX:+DebugNonSafepointsWithout it, code inlined by the JIT can be mislocated, and some small inlined methods don’t show up at all. These two flags have no measurable performance cost, so you might as well enable them by default on any environment you plan to profile. When the agent is attached at runtime to a JVM started without these flags, the profiler enables the debug information itself, but only for methods compiled after it arrives.
Permissions and containers
perf_events needs kernel access. On a regular Linux box, you generally need:
sysctl kernel.perf_event_paranoid=1   # allows user-space profiling
sysctl kernel.kptr_restrict=0         # kernel symbols in stacks
In a container, it’s another story. The container in our example was running with perf_event_paranoid at 4, and Docker’s default seccomp profile blocks the perf_event_open call anyway. Yet asprof -e cpu worked without complaining. The reason: in recent versions, when perf_events isn’t available, the cpu mode silently falls back to a backup engine, ctimer, which relies on a POSIX timer and needs no permission. The only visible sign is the absence of kernel frames in the graph.
To see it for yourself, ask for an event that only exists in perf_events:
$ asprof -d 5 -e cache-misses Shop
[WARN] Kernel symbols are unavailable due to restrictions. Try
  sysctl kernel.perf_event_paranoid=1
  sysctl kernel.kptr_restrict=0
[WARN] perf_event_open for TID 246 failed: Operation not permitted
...
[ERROR] Perf events unavailable. Try --fdtransfer or --all-user option or 'sysctl kernel.perf_event_paranoid=1'
Three ways out, in order of simplicity. Accept ctimer, which is enough to profile application code. Start the container with --security-opt seccomp=unconfined and sometimes --cap-add SYS_ADMIN, if you control the deployment. Or use --fdtransfer, which has a privileged process open the perf descriptors and hand them to the unprivileged JVM. On macOS, there are no perf_events at all: the cpu mode relies on itimer there, and only user-space code is visible.
Then there’s the question of reaching the JVM. Three situations:
- From inside the container, if the image has a shell: copy the archive in, and
asprofattaches normally. That’s what was done here. - From the host, as a privileged user: give the pid as the host sees it (
docker top <container>), andasprofswitches into the container’s namespaces on its own.libasyncProfiler.somust be reachable inside the container at the same absolute path as on the host, or you specify it with--libpath. - On Kubernetes, with an image without a shell (distroless):
kubectl debugwith--targetstarts an ephemeral container in the same process namespace as the application. Put an image that contains async-profiler in it, and you’re back to the first case.
Two classic errors at attach time. Could not start attach mechanism means the /tmp/.java_pidNNN socket isn’t reachable: it was deleted by a /tmp cleanup, or the profiler’s /tmp isn’t the JVM’s, or the JVM was started with -XX:+DisableAttachMechanism. And Failed to change credentials means the profiler isn’t running as the same user as the JVM, which the attach mechanism requires.
Finally, a detail that jumps out on the screenshots in this article: frames named /usr/lib/aarch64-linux-gnu/libc.so.6. The Docker image’s libc ships without symbols, so the profiler shows the library name instead of the function name. You know you’re in libc, not in which function. For application code, it doesn’t matter: the Java frames below are intact.
Profiling from startup
To capture what happens at boot, or to integrate profiling into an automated run, attach the agent directly:
java -agentpath:/opt/async-profiler/lib/libasyncProfiler.so=start,event=cpu,file=profile.jfr \
     -jar app.jar
The options are the same as on the command line, separated by commas. The agent then sees every method compiled from the start, with full debug information.
Recording everything in JFR
A single HTML file holds a single event. To measure CPU, wall-clock, allocations and locks at the same time, the output has to be JFR:
asprof -d 30 --all -f all.jfr Shop--all enables cpu, wall, alloc, live, lock and nativemem together. The file opens in JDK Mission Control, and jfr summary all.jfr lists its content:
 Event Type                          Count  Size (bytes)
=========================================================
 profiler.Free                       27374        492732
 jdk.JavaMonitorEnter                 7061        169464
 jdk.ObjectAllocationInNewTLAB        5025         93986
 profiler.WallClockSample             1704         28225
 jdk.ExecutionSample                   157          2158
To get a flamegraph out of it, jfrconv converts a recording to HTML, one event at a time:
jfrconv --cpu   -o html all.jfr cpu.html
jfrconv --alloc -o html all.jfr alloc.html
jfrconv --lock  -o html all.jfr lock.html
It also works with a JFR recording produced by the JVM itself, without async-profiler. And with --diff, jfrconv compares two profiles and colours what grew or shrank, which the flamegraph article shows on our example.
What about native memory?
Since version 4, the nativemem mode intercepts malloc and free. It’s for when the process RSS climbs while the Java heap is fine: a native JDBC driver, a compression library, DirectByteBuffers. The output goes to JFR, and jfrconv --nativemem --leak keeps only the allocations that were never freed. It’s the natural complement to the off-heap memory article.
async-profiler or JFR?
Both sample, both run in production. JFR is built into the JDK, needs no external binary, and records far more than stacks: GC, compilation, I/O, exceptions. It’s the right choice for a background recording that’s always on.
async-profiler is better on the stacks themselves. It sees native and JVM frames, doesn’t suffer from safepoint bias on CPU, and outputs a flamegraph in one command. The wall mode has no equally simple equivalent in JFR. To answer “why is this service slow right now” quickly, it’s the one.
Virtual threads and coroutines
On Java 21 and later, async-profiler sees the code running in a virtual thread. But a virtual thread that waits is unmounted from its carrier: it’s on no stack, and the wall mode doesn’t show it. Waits and pinning are better diagnosed with JFR, as explained in the virtual threads article.
For Kotlin coroutines, the CPU profile is accurate, but a suspended coroutine is on no stack. The wall mode shows the dispatcher’s threads waiting, not the coroutine that waits. The dedicated article explains how to get the information back.
In short
asprof -d 30 -f profile.html <pid> is enough for a first CPU profile. The wall mode with -t and an -I filter finds the waits, the alloc mode finds GC pressure, the lock mode finds contended locks.
Start your JVMs with -XX:+UnlockDiagnosticVMOptions -XX:+DebugNonSafepoints. In a container, cpu silently falls back to ctimer, without kernel frames, and that’s almost always enough.
On our example, three profiles found three problems in under a minute of measurement. After the fix, throughput was multiplied by four, and the second profile shows that the ceiling is now downstream.
What next?
You have a profile.html in front of you. A flamegraph is quick to read once you know the rules of the game, and that’s exactly the subject of the next article: How to read a flamegraph.